
Visualising statistics on Google Earth

So one of the things I’ve been working on is a physical direct-mail campaign management system, using addresses sourced from various mailing list databases, and, due to the absolutely shocking quality of these lists, we’ve been getting quite a lot of RTS (Return to Sender) envelopes. Hence the blog post a couple of weeks ago regarding scanning Australia Post DPID barcodes.
So at any rate, I thought it would be interesting to visualise our sent/RTS data on a big spinny sphere representing the earth, and luckily, there’s an application that allows you to do that.
So here’s a cutdown version of the KML I came up with, which you might be able to use as a basis for your own visualisation.
Once you open it in Google Earth, you should see a tree menu down the side of the application which gives you a few things:
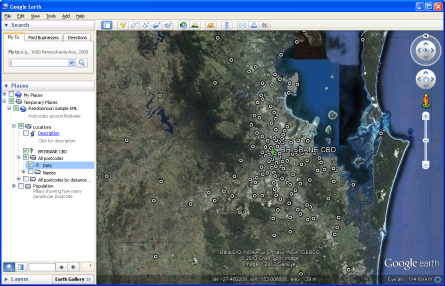
- Postcodes around Brisbane visualised as round dots at ground level
There are two subitems here, to view the postcodes with and without labels, since things look a bit cluttered with everything turned on at high zoom levels. - Postcodes at various distances around the CBD visualised as multicoloured pushpins at ground level
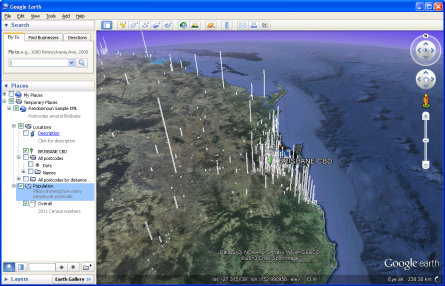
- Postcodes around Brisbane visualised as grey pillars
If you double-click the menu items and click the checkboxes next to each item, you should hopefully see something a bit like this:
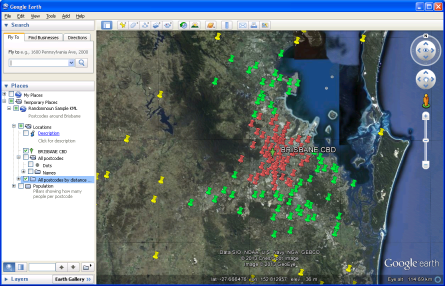
Which you can then zoom and spin around until you’re positively giddy with statistics.
Fur the purposes of this blog entry, the height of each pillar in the third visualisation is the population of that suburb according to data extracted from the Australia Bureau of Statistics 2011 Census DataPacks.
If you’re really keen, they also have downloads of postal and electoral boundaries which you could use to make things look vaguely more accurate.
If you’ve got Google Earth already installed on your system, then you can see the third visualisation in your browser here: (use shift+mousedrag to tilt, ctrl+mousedrag to change perspective)
I’ll put in a link to a separate page later on.
For those who are interested, the postcode list has been sourced from Australia Post, and the longitude/latitude data has been sourced by cross-matching this against the Google Geocoding API (this cross-matching isn’t perfect, but it’s good enough for my purposes). On second googling, it appears that someone has already done this, so that could have saved me some time.
Because I’m that sort of person, I’ve compiled the data into an Excel spreadsheet that constructs the Placemark XML elements for you. You can download that spreadsheet, and the KML/KMZ file containing the complete XML here.
(A .kmz file is just a .kml file that has been zipped up; if you rename
2013-02-19-googleEarthBlog.kmz
to
2013-02-19-googleEarthBlog.zip
you should be able to open it and inspect the .kml directly).
Oh, and if you do use the spreadsheet, you’ll need to enable macros in order to allow the spreadsheet to work around the 255 character limit in the Excel EVAL function. It’s not encrypted, so you can turn off macros and inspect the code first if you’re the sort of person who does that.
Cheers,
Greg.
Updated 2013-02-20: Added the Creative Commons Attribution 3.0 Unported License to the downloads in this post.
Updated 2013-07-09: Disabled the google earth plugin in this post since it was crashing some browsers.


