
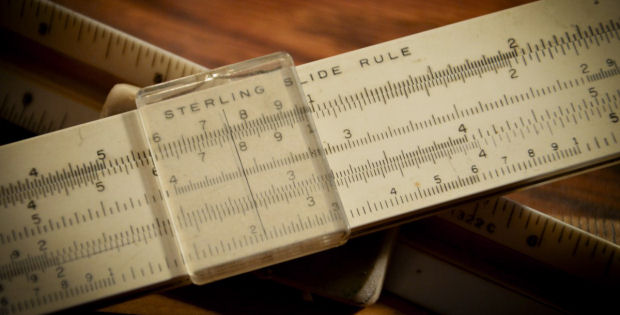
Pointless
So following on from ‘every piece of software eventually becomes microsoft office’ post, one day you’ll find yourself reimplementing powerpoint.
You’ll be doing this in javascript and html, because everything’s the web these days, and to start you on that journey, you’ll be using drawio, because it’s open source and not as crap as the alternatives.
Drawio is a great bit of kit, but suffers from some fairly fundamental design problems which I’m going to go into here.
tldr: Essentially all their distances are labelled wrong, and even if they were labelled right, they’re still wrong.
NB: I’m also going to continue to call it drawio, even though it’s now called drawing.net, which is built on top of mxEditor, which is built on top of mxGraph, all of which appear to be in an umbrella organisation called JGraph, because whoever developed this really wanted to own the whole ‘drawing things in javascript’ namespace.
Here’s what drawio looks like embedded on a page:

If I’ved hooked that up correctly, you should be able to double click on the diagram and get an editor where you can change the diagram. Try scrolling up if it disappears. So what you get with next to no effort whatsoever is the ability for a user to:
- draw shapes, move them around, resize them, colour them in, and join them up
- draw text, apply common types of formatting at the character, paragraph and shape level
Which gets you a fair chunk of the way towards the UI of a general-purpose report creation tool ( where a ‘report’ is something a client wants to actually print to a physical piece of paper, or as is much more likely these days, a PDF which can then be printed to a physical piece of paper ).
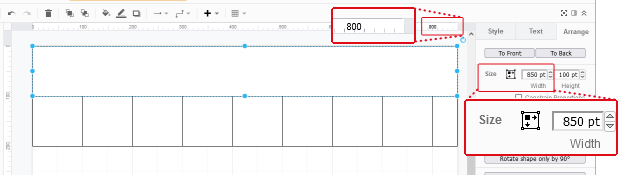
You might notice that you can select the ‘paper size’ from the format panel, and that those sizes affect the drawing area, which in the full-page version of the app is measured on some rulers up the top and the left of the diagram. You’ll also notice that drawio gives you a few way of measuring things, with numbers appearing
as you drag things around: 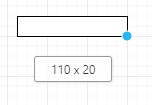
or in text fields: 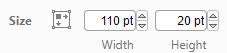
This blog is going to tell you that those measurements are all wrong, and what you can do to get them right for someone who actually wants 10pt text to be 10pt in their report, or for a cm to actually be a cm.
Fonts
Before we go into the differences between drawio and the rest of the world, Microsoft and the rest of the world, and your web browser and a piece of paper, you’ll also notice that every piece of software you’ve ever encountered measures font sizes in “points”, which is an archaic term for a 1/72 of an inch.
Everyone thought using ¹⁄₇₂” was perfectly reasonable back when there were 72 grains to the groat but is somehow still in modern usage.
Every computer in existence pretends that it uses 96 dots per inch ( DPI ) on the web, even the ones that say they have more DPI (e.g. your fancy retina displays), because they also scale the ‘dot’ in ‘DPI’ so that it’s 96 DPI and the ones that say they have less DPI (e.g. your apple-derived systems which say they’re 72 DPI) which pretend to be 96 on the web because otherwise the fonts look too big.
Take a read of https://www.scantips.com/no72dpib.html if you want a history lesson on that.
Most computer monitors have fixed resolutions ( e.g. my monitor is 2560×1440 dots a.k.a. pixels ) and varying sizes ( mine is 27″ across the diagonal ), which will give some value for DPI, but considering other monitors have different physical sizes but will have the same resolution means that DPI value isn’t going to be consistent across different displays.
So let’s just give up on being able to represent an inch accurately on a display, but that’s OK because no-one expects to be able to put a physical ruler up against their monitor to measure something accurately.
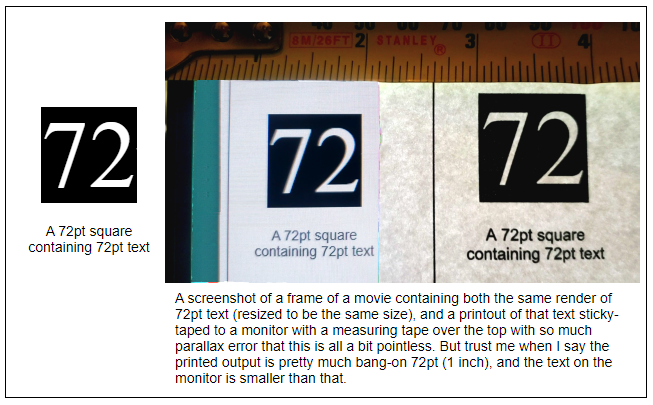
Fun fact: if you printed that out from your LaserWriter™® from a dusty 1984-era Macintosh™®, those would all line up. So that’s progress for you. On the other hand, they did advertise those WYSIWYG capabilities with women draped over lamborghinis, which you don’t get so much nowadays. *rocks back on rocking chair, spits into copper spittoon* apart from ads for graphics cards I guess. and motherboards. and light artillery. anyway.
Also remember that font sizes are measured in terms of a platonic ‘em square‘ rather than some property of the shapes of the actual letters, so the characters in different fonts (e.g. Times New Roman and Copperplate Century Script Italic) at the same point size may appear to have different heights. I’m ignoring that for now.
What was I talking about again ?
What we’re more interested in here is the paper output, which is something a bit more easily comparable than monitor output.
Units
OK so because the internet is american, and americans still use imperial length measurements handed down from their freedom-despising English colonisers, you’ll notice that the default paper sizes are ‘Letter’ and ‘Legal’, which are defined in terms of inches rather than ‘A4’ which is defined in terms of golden rectangles, the speed of light and the vibration of caesium atoms, which is much more pragmatic.
Here’s a table of some typical paper sizes in Imperial and SI units
| Letter | 8.5 x 11 inches |
| Letter landscape | 11 x 8.5 inches |
| Legal | 8.5 x 14 inches |
| Legal landscape | 14 x 8.5 inches |
| A4 | 297 x 210 mm |
| A4 landscape | 210 x 297 mm |
There’s a whole lot more than that of course, but those are the ones that everyone uses.
First off, when you select ‘Letter’ in drawio, you’ll notice the ruler goes from 0 to 850 and 0 to 1100, so you might be thinking “oh, ok, so each unit is a 1/100th of an inch, a.k.a. a centi-inch, or a ciinch, or cin, a unit which literally nobody else uses“.
So those paper sizes become
| Letter | 850 x 1100 cin |
| Letter landscape | 1100 x 850 cin |
| Legal | 850 x 1400 cin |
| Legal landscape | 1400 x 850 cin |
| A4 | 827 x 1169 cin |
| A4 landscape | 1169 x 827 cin |
And then you might wonder why drawio has labelled these units as “pt” on the Format/Arrange panel, when a “pt” is defined as 1/72th of an inch.
And then you might wonder why, when you draw a box which is 72pt x 72pt, why the dimensions of that box doesn’t look anything like the bounds of a character drawn in a 72pt font.
And the reason for that is because the people who created drawio have no coherent concept of distance, so you’ll be compensating for that in your code which prints out drawio diagrams from HTML, or converts drawio to and from pptx.
A coherent concept of distance
So what you need to remember is that
- when you see a “pt” measurement in drawio (which I’ll call a shape-point), what that number actually is is 1/100th of an inch, which is not what a ‘point’ is to the rest of the world.
In the SVG diagram that drawio creates, each 1/100th of inch is a pixel ( “px” ), which is also not what a pixel usually represents outside of drawio. - when you see a “pt” font measurement in drawio (which I’ll call a font-point), what that number actually is is a font size at 96 DPI, where by definition, there’s 72 font-points in an inch, and an inch is 96 pixels, which is not the 100 DPI of the shape-point measurements.
So for starters just pretend that all the shape measurements in the format panel are actually labelled “cin” instead of “pt” and for reasons that will be explained below, the font measurements in the format panel aren’t labelled correctly either. Let’s just say that you’ll need a new measurement label for those, let’s call them “bpt” for bastardised-points.
You’ll also discover that if you paste in HTML from some other website into a drawio text shape, that those font sizes become even more inaccurate, but that’s a completely different kettle of fish.
Let’s say you print out a drawio diagram that is on a ‘letter’ page.
You’re going to do this by getting a virtual browser to render the page, and then convert that page to PDF, a bit like hitting ‘Print’ in your browser and saving it down as a PDF.
It turns out the under the hood, drawio uses SVG to represent shapes, and those 0 to 850 and 0 to 1100 units mentioned earlier correspond to a pixel measurement (“px” in css) of 0 to 850 and 0 to 1100.
So I’m just pointing out that a “px” unit is neither:
- the pt measurement drawio would have you believe from the UI labels, nor
- the cin measurement drawio would have you believe from the paper dimensions
If we want the paper sizes to be accurate, then we’ll need to adjust the “px” in drawio’s SVG to a centi-inch, making it 100 pixels in an inch, otherwise known as 100 DPI. There is no web browser in existence that uses 100 DPI; instead, they all use 96 DPI.
So what you’ll be doing is zooming that diagram by 96% just before you print it, so that your 100 pixels to an inch diagram becomes 96 pixels to an inch, because that’s what it needs to be if you want a letter-sized diagram to generate a letter-sized PDF. You’ll also be removing the headers/footers that the browser normally adds to the page, and any margins, so that any full-page background images cover the entire paper size.
The magic CSS you need to sprinkle on your page to do that looks like this:
<style>
@media print {
  /* @page size now set in javascript */
  body {
    background: none;
  }
  div.portrait, div.landscape {
    margin: 0;
    padding: 0;
    border: none;
    background: none;
    break-inside: avoid;
    page-break-inside: avoid;
    -webkit-print-color-adjust: exact;
  }
}
@media print { @page { size: landscape; } }
</style>
<div class="viewport"><div class="landscape" style="width: 11in; height: 8.5in"><svg>
  ... the svg diagram ...
</svg></div></div>
And the magic bit of javascript to zoom the diagram looks like this:
var graph = new Graph(container); // container element
graph.setEnabled(false);
graph.setPanning(false);
graph.minFitScale = null;
graph.maxFitScale = null;
graph.centerZoom = true;
graph.pageVisible = true;

// dataNode is a <diagram> node contained in a multi-page drawio XML source file
var codec = new mxCodec(dataNode.ownerDocument);
codec.decode(dataNode, graph.getModel());
graph.view.setScale(0.96);
Well alrighty then, but that means any fonts which were previously being rendered at 96 DPI (i.e. before scaling, a 72pt font would appear 96px high), are now being rendered at 96 * 96/100 or 92.16 DPI (i.e. after scaling, a 72pt font would appear 92.16px high). So you’ll need to compensate for that by expanding the font by 100/96 in the drawio editor, so that when the user selects “72pt” then they get something that actually prints an inch high (100px in the prescale units, 96px in the postscale units).
There’s a couple of ways you can do that, none of which are really satisfactory.
First of all, notice that when you place a text shape in drawio, what you’re really doing is adding a foreignObject into the SVG, which in this instance is a foreignObject containing HTML.
The reason drawio does this is so you can do things like format things in bold and italics in the middle of a piece of text, which is something real users might expect to be able to do, but which is an utter bastard to do in SVG unless you enjoy measuring the size of individual characters in text spans.
So anyway what you might do is a create your own quasi-text shape in drawio that scales that foreignObject by 100/96 so that when you scale if by 96/100 at the end, the resulting text has the right dimensions on the page. And that more or less works.
But you might still need to support the native drawio text shape as well because you discovered this whole measurement bastardry a bit late in the development process, in which case you’ll just have to acknowledge that the units entered by the user are wrong, and contemplate changing the format panel to label those units as “cin” instead of “pt”, and label font points as bastard-points ‘bpt’ which are (1/72 * 96/100) = 1/75 of an inch instead of the much more universally acknowledged 1/72 of an inch for a real point.
Which you’re not going to do because you run out of time, so you just hope that nobody notices, which apparently no-one has up until now, and write up a post for your website instead.
Couple of other things I should mention:
- different browsers (and even the same browser on different operating systems) will render the same page differently, so things like wordwrap might be slightly different from one browser to another due to the vagaries of kerning, sub-pixel alignment, and aliasing.
- up until Nov 2021-ish, chrome didn’t render foreignObjects properly in SVGs, so your layering might look a bit weird. Mozilla’s OK though.
There’s probably other solutions (e.g. changing drawio’s concept of how big a ‘letter’ page is) but those have their own set of problems which you can discover if you choose to do that.
PPTX
Okay so Microsoft has also had to bridge the gap between imperial and metric units, which they’ve also decided to solve by inventing their own measurement system. That measurement system is called “EMUs” which stands for English Metric Units, which is a little bit better than drawio “cin” measurements inasmuch as they can be expressed as integers instead of rational numbers when converting between them up to some reasonable level of accuracy.
And to their credit, they don’t outright lie to you when they label those measurements in their UI ( they will round those numbers but it’s still the right ballpark ).
An EMU is 1/360,000 of a centimetre,
whcih is 1/914400 of an inch,
which is 1/12700 of a point
which is 1/9525 of a pixel ( at 96 DPI ).
So you may not be able to get a camel to walk through the eye of a needle, but you could probably herd a few emus through there. How terribly amusing.
So those paper sizes in EMUs are
| Letter | 7772400 x 10058400 EMUs |
| Letter landscape | 10058400 x 7772400 EMUs |
| Legal | 7772400 x 12801600 EMUs |
| Legal landscape | 12801600 x 7772400 EMUs |
| A4 | 10692000 x 7560000 EMUs |
| A4 landscape | 7560000 x 10692000 EMUs |
All distance measurements in Word, Excel and Powerpoint file formats are expressed in EMUs, except for the ones measured in points, or the ones measured in 100th of a point or the ones measured in halfs of a point, or the ones measured in twips (1/20th of a point), but those can usually be converted to EMUs without any loss of precision. There’s also relative measurements and angle measurements, but let’s ignore those.
So if you’re converting from PPTX to drawio you’ll be converting EMUs to cins, and points to bastard points, and doing the opposite when converting from drawio back into PPTX.
Fonts in powerpoint are defined in run properties, paragraph properties and shape properties, including multiple paragraph level properties set at both the shape and theme level, + two levels of templating ( slideLayouts and slideMasters ), which all interact with each other in unintuitive and undocumented ways. Also on top of that is the concept of ‘autosizing‘ which can affect text size, as well as 3d effects and wordart which you’re going to completely ignore unless you’ve got the resources of google at your disposal. By which I mean
the billions of dollars of developer time, not access to the google search engine.
Fonts in office products also have a fairly complicated and mostly undocumented fallback system if the computer you’re viewing the document on doesn’t have the font installed,
which you’re probably going to ignore as well until the client complains about it and then you’ll hack in something that sort of mostly works.
You’re probably going to limit yourself to just the types of formatting that can be easily expressed in HTML, since that’s what you’re going to be converting it to and from. In the drawio editor, text is editted by using a thin wrapper around a contentEditable DIV, and it’s not like you’re going to rewrite that.
But anyway, converting to and from powerpoint is complicated enough to describe in a separate blog post I reckon.


