To PV Or Not To PV; That Is The Question
Whether ’tis nobler in the mind to suffer
The slings and arrows of outrageous fortune,
Or to just bite the bullet and put up some bloody solar panels, already.
I mean it’s hot enough.
Innit .
— Bill S.
After my last electricity bill, I’ve been looking a bit more at putting some Photovoltaic (PV) Solar Panels on the roof to try to curb my bills a bit.
Prior to doing so, I thought I’d do some back-of-the-envelope spreadsheeting, which I thought other people might find useful.
Bills, bills, bills !
This might make more sense if you can see what my bills have looked like over the past few years, once removed from their plastic sleeve folders and presented in a series of blue rectangles.
I’m currently billed by Origin on a single domestic tariff, who use the Energex infrastructure and network to get the actual electrons flowing.
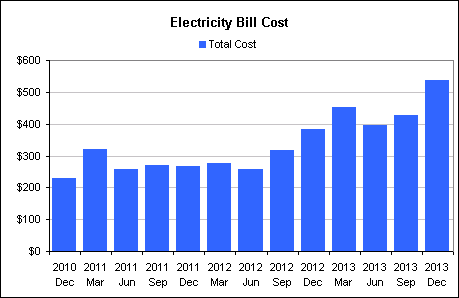
So a fairly steep increase in the last bill. It has been a bloody hot summer, so perhaps I’ve been using the air-conditioning more (and people have been dropping around here a bit, which tends to increase air-conditioner use), but still, a $100 increase from one Q to the next is a bit rich.
But not all of that electricity bill is used to pay for electricity. I get charged a fixed fee for my connection, and some bills also include late fees and ambulance levies (which were included on Qld electricity bills until around Sep 2011). Can’t really expect solar panels to do much about that.
Splitting these various costs out, and tax (which is charged on the fixed fee and the electricity, but not on the ambo levies or late fees), I get this slightly-the-same, but also-slightly-different chart:
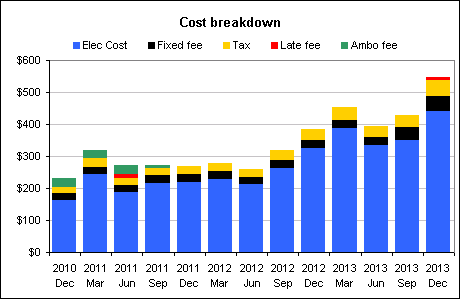
So all I’m really interested in, for the sake of determining whether solar panels are worthwhile, is my actual electricity costs (the blocks in blue above).
Obviously enough, my electricity cost is closely related to my electricity usage over these quarters as well, so let’s draw that on there as well.
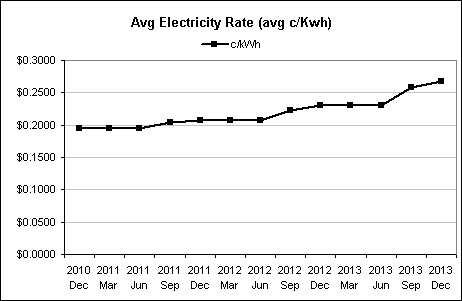
I’ve scaled the two axes below so that Cost (in AUD$) and Usage (in kWh) align in the first Quarter (Dec 2010). The reason the Cost and Usage graphs diverge after that is due to changes in the electricity rate (in c/kWh). So as you can see, Mar 2013 and Dec 2013 have about the same usage, but very different costs.
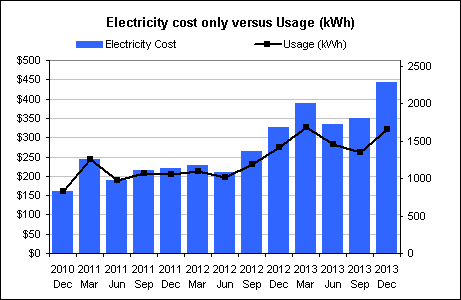
Dividing one by the other gives the electricity rate (below). As you’d expect the rate increased between Mar and Dec from 23.07c to 26.73c per kWh.
How would solar panels have affected my bills, historically?
Right. With this all in mind, how effective are solar panels in reducing these costs ?
Obviously I can’t change the rate at which Origin/Energex is going to charge for electricity.
I can reduce the amount of electricity I purchase though my generating my own, though. According to this guide to buying household solar panels produced by the Clean Energy Council, a 3kW solar panel array produces, on average, about 12.6kW per day in Brisbane (page 4), since it can’t produce at night, and averaging out other environmental conditions, like cloudy days.
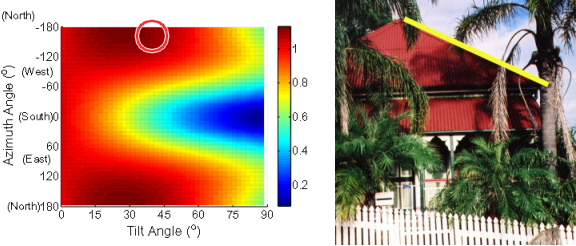
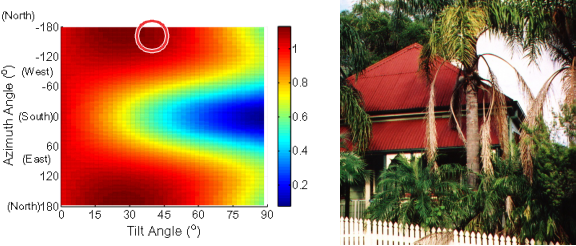
Now because I live in Queensland, my roof is facing north, and the angle of my roof is 42 degrees, I should expect to get about 90-100% of the maximum output out of these panels, according to this incredibly detailed work done by the boffins at the School of ITEE at the University of Queensland.
So multiplying out 12.6kW per day by (conservatively) 90% efficiency by 365 days and dividing by 4 quarters, I should expect a quarterly generation capacity of 1034.775kW, which, assuming I had installed one back in the day, and then used all the electricity the panels produce, retrospectively would have made that earlier graph of my electricity costs look like this:
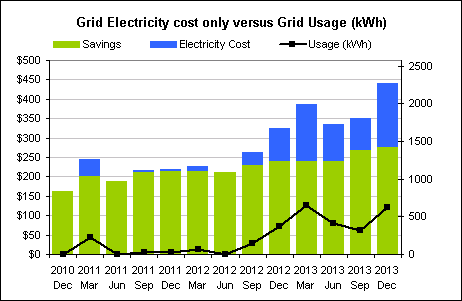
Notice in some quarters I’d be surviving completely off solar energy . In these quarters, even though I’ve kept my actual energy consumption the same, my usage as far as the energy grid is concerned has gone down to zero .
But how much does it cost ?
So this looks like a pretty good deal, but those green bars still aren’t ‘free’ because I still need to pay for the panels to be installed.
So I check some websites and email around for installation costs, and settle for a 3kW system from True Value Solar (TVS). They reckon it’s going to cost $3000 (although this isn’t really the case, more on this later).
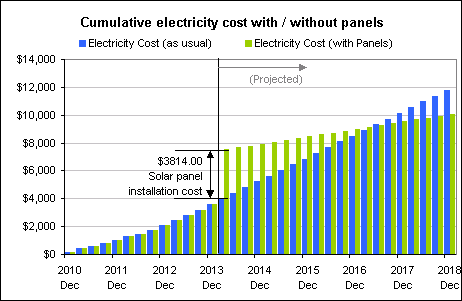
Seeing as I’m now looking at returns in the long term, I thought I’d chart cumulative costs over time and see how long it takes for the panels to save me as much money as it costs to install them (after which, I will be getting that solar energy ‘for free’).
Here’s another chart with cumulative electricity costs for the historical quarters Dec 2010 to Dec 2013, and my projected costs if I continue business as usual (in blue, assuming I have the same annual energy usage as 2013 and Energex continues to charge the same c/kWh charged as my last bill). I’ve also included a second chart on here which shows those same costs with the TVS solar panels (in green); there’s a spike in my next bill (due to the cost of installing the panels), but the rate of increase after that is shallower.
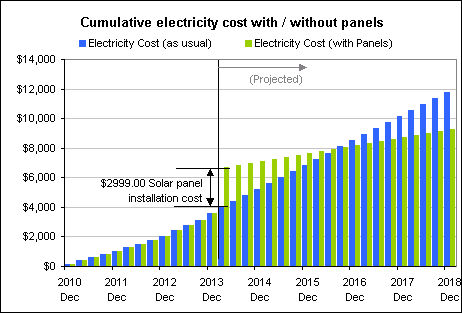
The crossover point turns out to be 2.46 years in the future, which is close enough for me to think it’s worthwhile.
How much would you expect to pay ?
But wait! It costs more!
When TVS gave me the quote, they somehow forgot to mention that I need to get a ‘meter link’ installed ($165.00 for a single phase connection), and because my roof is on a steep slope (42 degrees) the installers asked for an extra $650.00 for safety gear and/or scaffolding, which they didn’t tell me about until after they turned up to install it, even though I’d previously emailed photos through to the sales guy.
My particular type of Queenslander roof is a bit surprising in Queensland, apparently .
I may also need to pay to get my old spinning-discs meter converted to a digital meter, although there appears to be some confusion on that depending on who you talk to… TVS said it would cost $300, but Origin tells me that Energex will install one for free.
So, anyway, increasing the original cost by the extra $815, that changes the sums slightly:
Making the system pay itself off after 3.13 years instead, which is, as it turns out, is still good enough for me.
I still haven’t got the bloody thing installed yet, so will let you know if my actuals are anything like my projections.